We have been busily working behind the scenes and are excited to release a few updates to bring you an improved experience, that I am sure will benefit you, in your tracking requirements. We are introducing the first phase of implementing both Zones filtering and Zone event reporting by way of introducing the notion of a Depot.
Depots
In its first instance, Vision Trak have now introduced a feature whereby we have electronically drawn zones around most of our customer’s business address. Only Vision Trak Staff can create/modify these depots at this stage as there is a lot more work involved in securing this feature for customer use.
In the interim we can assign One Depot (Zone) to an Asset. We can therefore subsequently filter data in our reports and create events when an asset leaves the depot and subsequently returns. Please note the following rules that apply to depots.
- An Asset can only belong to one Depot.
- Many assets can be assigned to one Depot.
- A Depot can only belong to one Customer.
- A Customer can have multiple Depots created to cater for multiple sites.
- A Depot now has a Timezone applied based on location. This means that each asset based on its depot location, will have a time zone set for future reporting purposes. This will aid multi state based customers and fleet managers that will now see reports with correct timezones applied for each asset individually based on its location, rather than the user login timezone.
Reports
If a depot has been assigned to an Asset, Depot related data will be included in our reports automatically. This can be easily viewed in the MVTL report.
MVTL REPORT
Without Depot Information
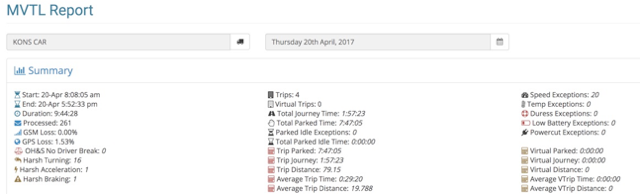
Without Depot Information
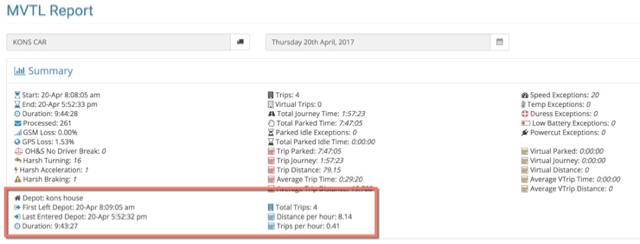
Depot information contain the first time it left the depot for the day and the last time it re-entered the depot for the day. We then provide you some extra metrics that calculates how long in total the asset was outside of the depot for the day, irrespective if returned and left depot previously. We also now analyze the time and distance traveled whilst outside of the depot and display these calculations accordingly.
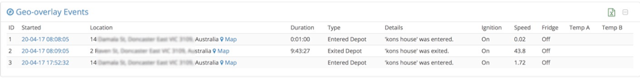
Each crossing of a Depot is also listed as a Geo-Overlay event in the report
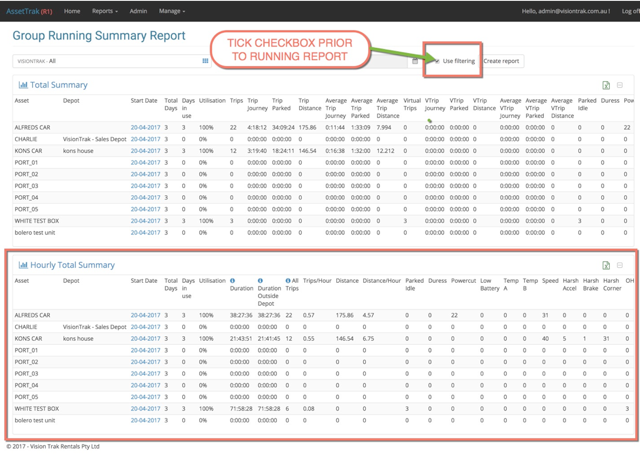
Running Summary Report
We have introduced two new sections to this report
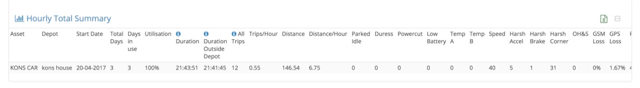
1. Hourly Total Summary – utilises information relating to the Depot and breaks it down on an hourly basis
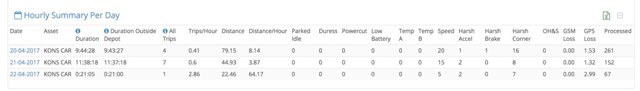
2. Hourly Summary Per Day – displays the information contained in the Hourly Total Summary for each day the report has been generated for.
Group Summary Report
If you tick the check box marked Use filtering prior to running this report it will generate an extra module containing and the Depot excluded data per asset averaged out on a per hour basis therefore enhancing the fleet utilisation data.