Categories
Uncategorized

Dashboard Update

1. Visit Report

We have reworked the Visit report and removed data fields that were deemed confusing or irrelevant to the majority of users.

We have added the following ibu4d to this report as per the previous update:

  • Enhanced Depot Detection Logic
  • Conditional Logic based on relevant events
  • Depot filtering
  • Information Icons

2. New Navigation Bar

3. New Full Screen Map

4. NewFull Screen Map

5. Hardware Profile Report Filtering

We have now introduced Hardware Report Filtering whereby we now hide unrelated columns of information throughout our various report if accessories are not installed.

For example, if an optional temperature solution is not installed then the report will no longer display this information.

With this update, we are now able to cater for multiple hardware profiles installations and only display the relevant information as needed.

Currently, we are working on adding additional features in conjunction with some new accessories reporting to our web tracking platform.


Categories
Updates

More features now available on the web portal!

New Features on the Web Portal!

We are pleased to announce that we have now completed our scheduled Web Portal update. Some of the updates that we have made are as follows.
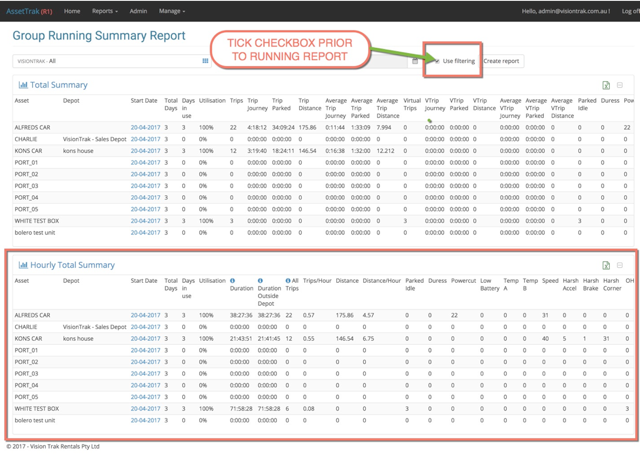
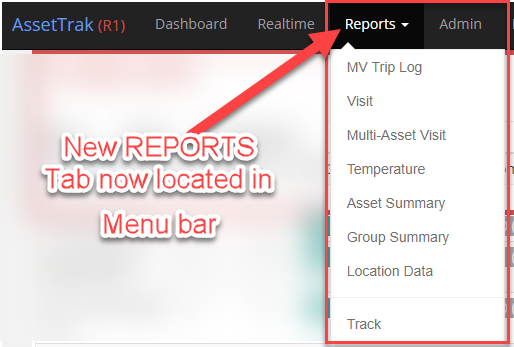
1. New Reports Tab

We have introduced a new Reports tab in the main menu tab section, that is now always visible to users irrespective of the existing page that they are on. A report can be requested by simply selecting the desired report from this tab and therefore allowing you to enter your desired vehicle and date parameters.

In addition to this new Reports tab, You may continue to use our existing quick report method in the Assets section of the Realtime page that is available to each and every asset. The quick report feature automatically populates the vehicle details for the current date and runs the chosen report in one click. This feature is not being retired.

2. On Demand Generation

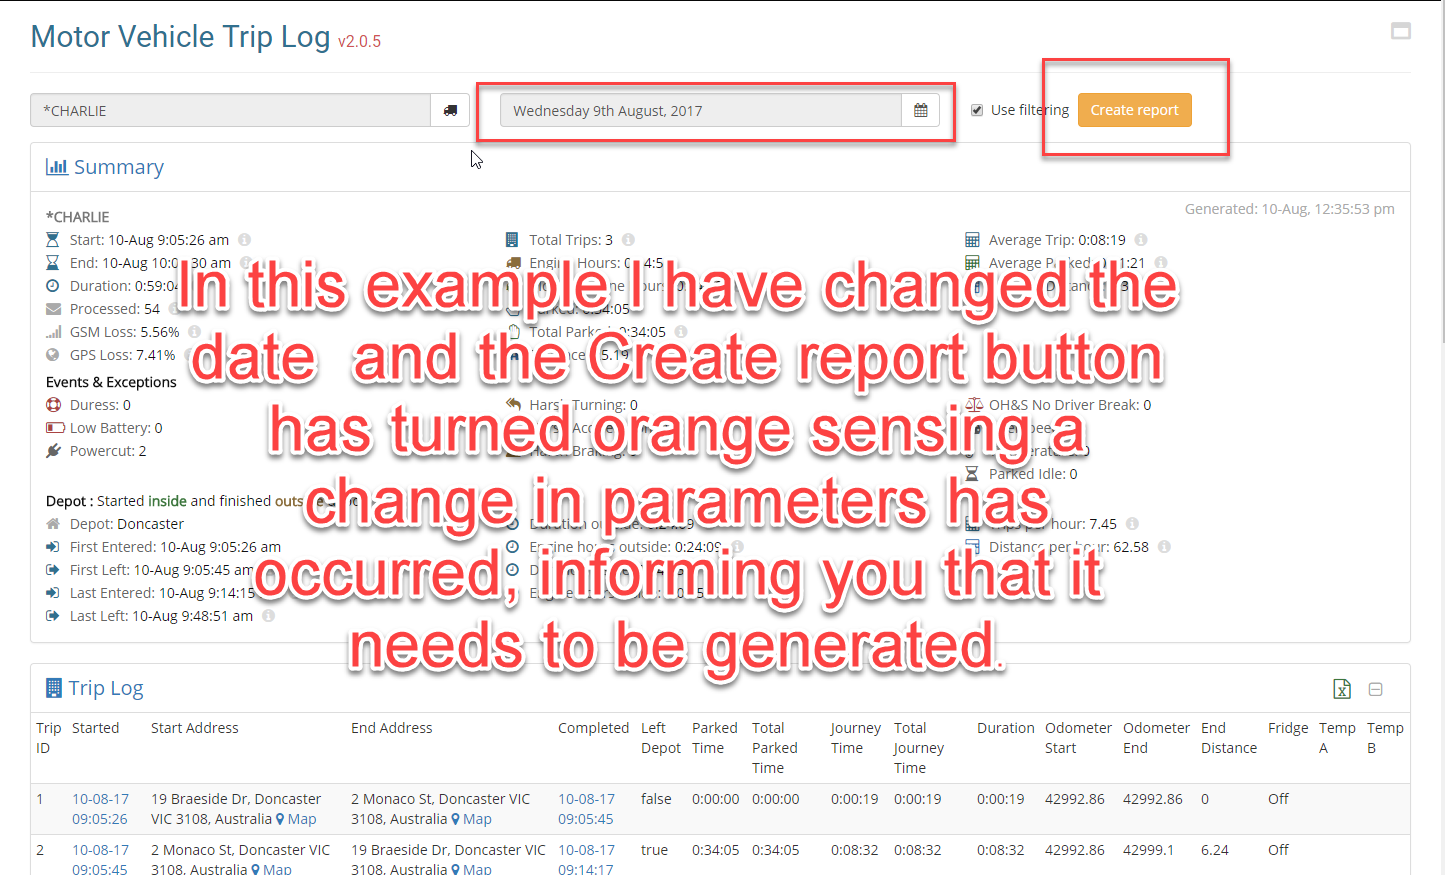
Reports can now be generated and regenerated on demand without having to navigate away from the page, streamlining the overall report generation process. If you change the date, vehicle or both after a report has been run, the “Create Report” button will turn orange, reminding you that the report needs to be generated.

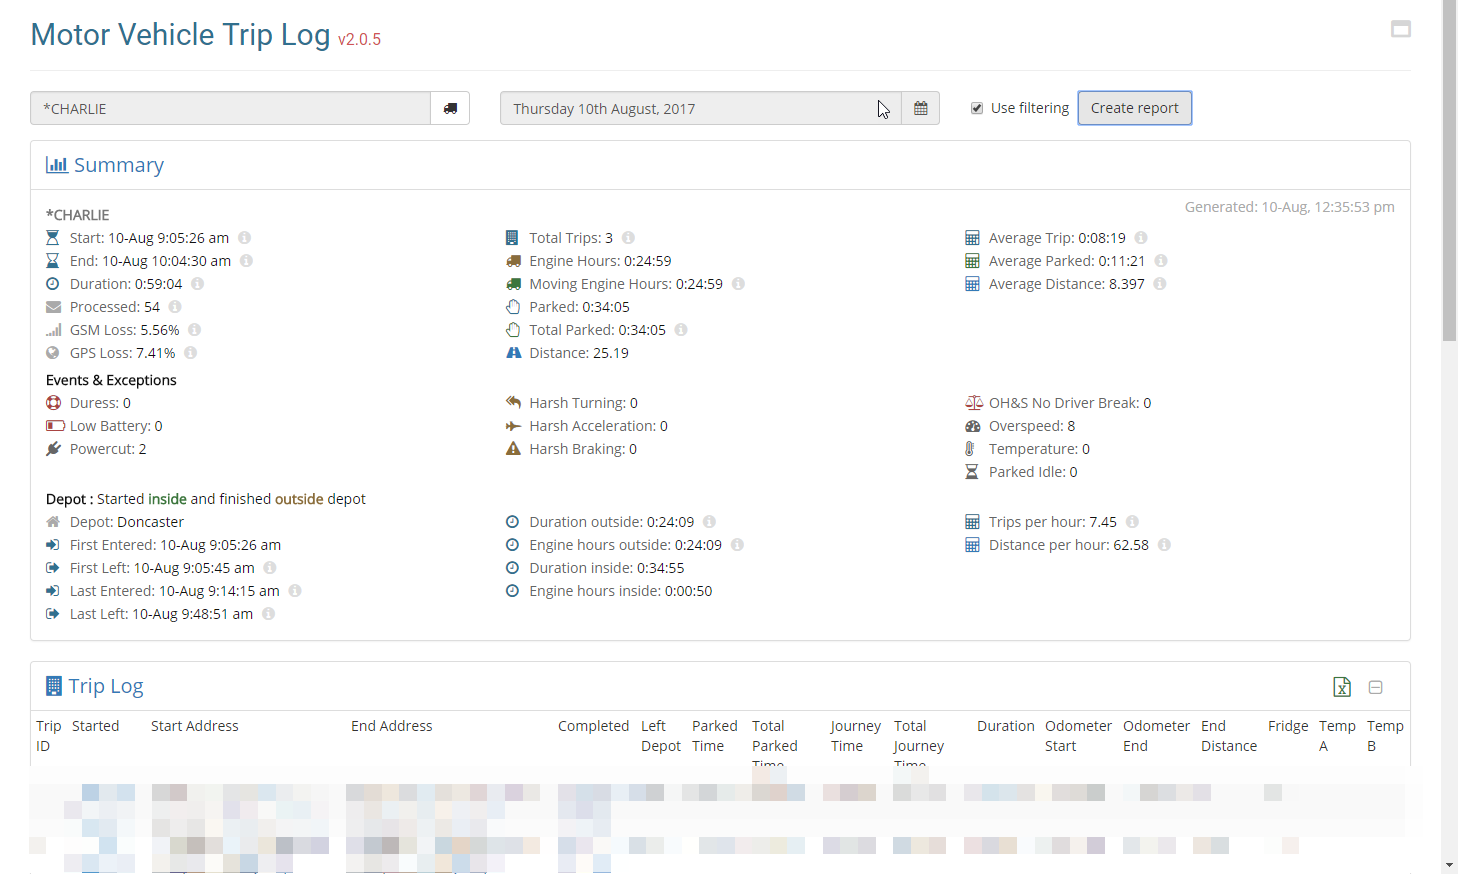
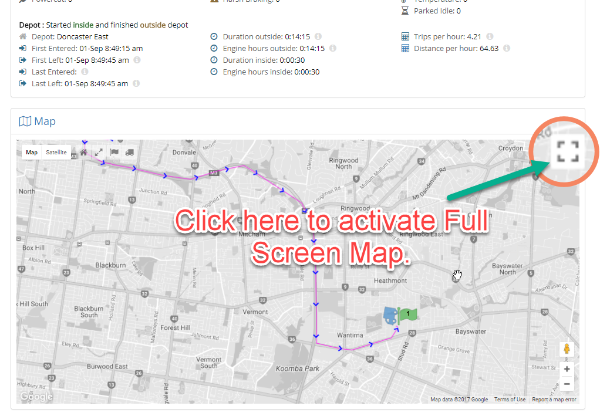
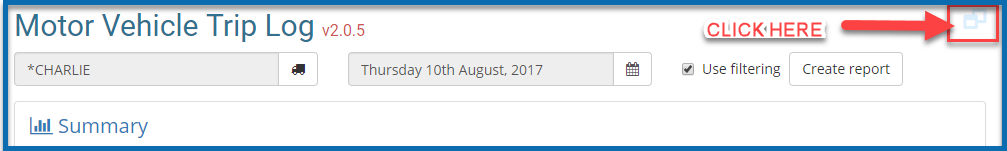
3. Hide menu (Fullscreen) button for all reports

We have added this button to allow you to hide the menubar on all reports, therefore allowing you to take advantage of your entire screen for the generated report.

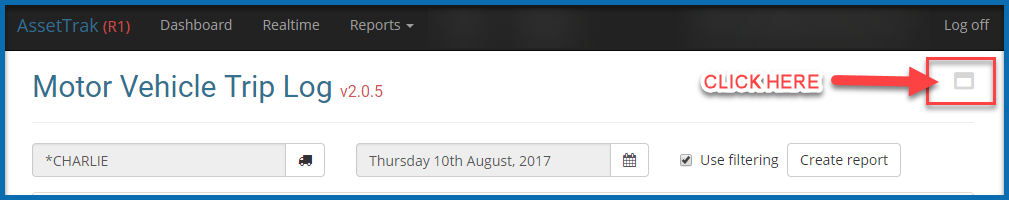
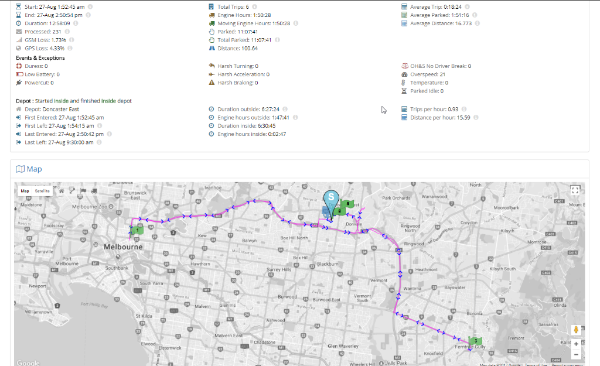
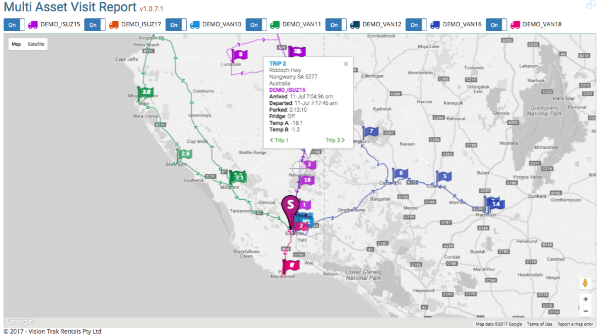
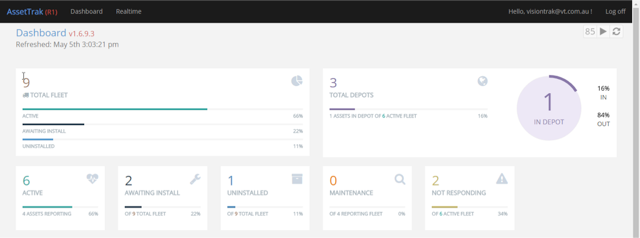
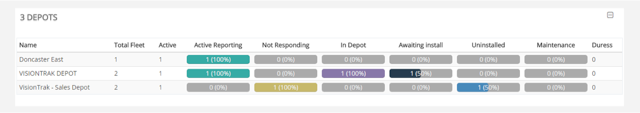
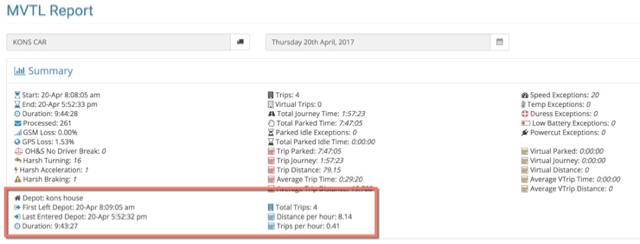
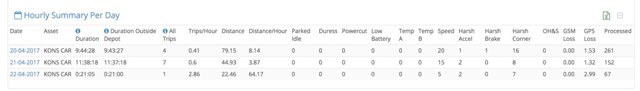
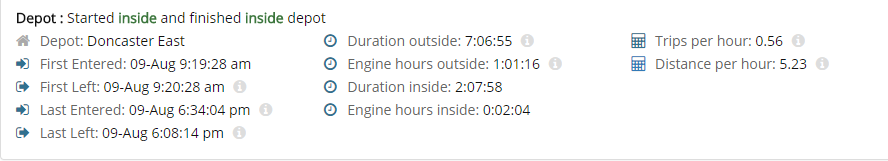
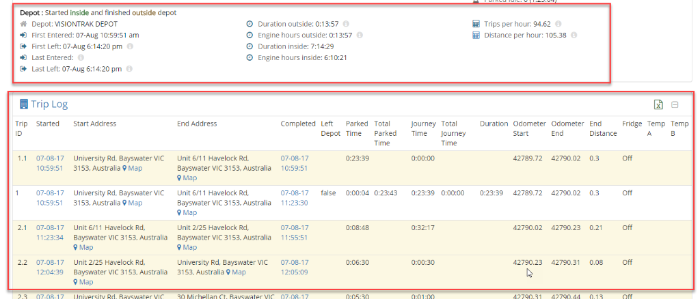
4. Enhanced Depot Detection Logic

Thank you to everyone that responded to the previous request for information regarding Depots. We were able to utilise this information and monitor vehicles that under various location conditions and reworked or logic in relation to the capture and reporting of depot related data.

We now support multiple scenarios relating to the use of depots in our reporting algorithms. We can now distinguish between vehicles that start either inside or outside of their allocated depots and subsequently when they end their day either inside or outside of an allocated depot. We will even know if it has returned multiple times throughout the day and make allowances for that as well in our data.

The benefit to our customers is that we can accurately determine how much time is spent within the allocated deport when compared to the time spent outside of the depot effectively making deliveries/visiting customers.

We can also determine the total engine hours spent outside the depot which could be used internally to monitor driver behaviour/delivery performance. This is further broken down into actual moving time as compared to idling time.

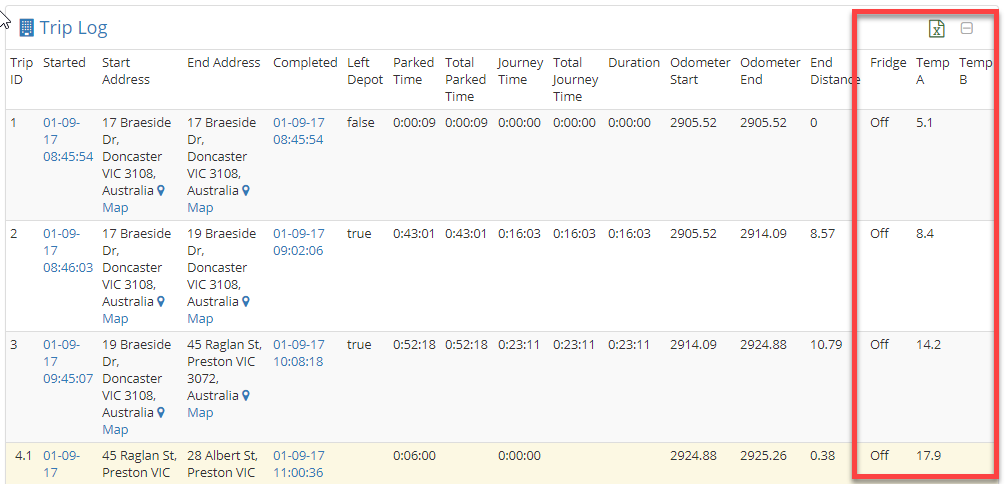
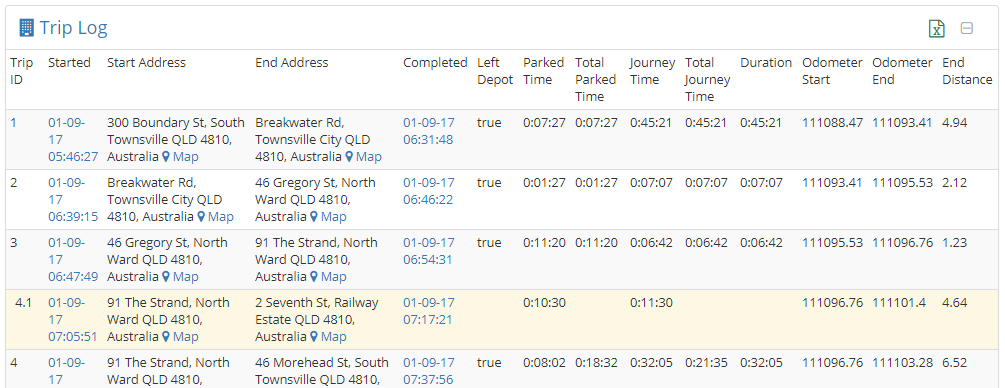
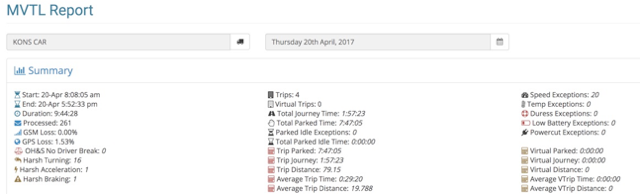
5. Enhanced MVTL Report

The Motor Vehicle Trip Log (MVTL) report is our most often used report and contains a wealth of information. Some would say too much information and times a little confusing.

We have reworked this report and removed data fields that were deemed confusing or irrelevant to the majority of users.

The sectional fields that contain data/exceptions and events, will only be shown if relevant to that vehicle on that day. As an example, If a vehicle does not have a temperature sensor installed there is no reason to display Temperature exception Section in that report. Furthermore, if a temperature sensor is installed but does not breach is temperature threshold, it will not show this section in the report.

This conditional logic will also apply for the following

  • Virtual Trips (Any idling for more than 5 minutes)
  • Parked Idle (Any idling for more than 10 minutes)
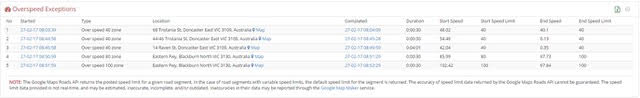
  • Overspeed Exceptions
  • General Exceptions
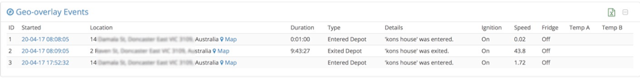
  • Geo Overlay Events (Enter/Exit Depot)

It appears some customers still find it hard to understand the difference between Trips and Virtual Trips.

A trip is defined as an engine ON event to the next subsequent engine OFF event. A trip is listed in our reports as a whole number eg. 1, 2, 3, 4, 5 etc. Virtual trips are now displayed prior to the actual trip in the MVTL report.

A Virtual trip is deemed as a partial trip of the actual trip as defined by Engine on and subsequent Engine off event. It is reported as the decimal component (subset) of the main trip. For example trip 2.1 is the first partial Virtual trip of the actual Trip number 2, that has been separated by and idling event of 5 minutes or more. You may assume that a delivery has been made at this reported location.
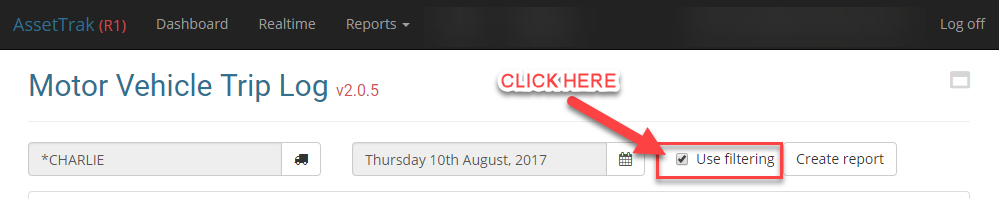
6. Depot filtering

By Default. Depot filtering is now applied to all reports. i.e. the First trip that departs depot is used (unless started outside of depot). To turn this filter off in the report you just uncheck the “Use filtering” checkbox prior to generating the report.

This new feature has been rolled out across our existing reports as well.

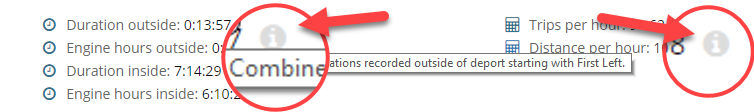
7. Information Icons

We have added more information icons throughout various reports in order to give additional information on how the values were derived.

8. Various

Other fixes include

  • Asset picker ordering – Assets are now correctly listed in alphabetical order when using the asset picker in a report
  • Asset picker now also remembers the last Depot Selected, so there is no need to select the depot again before selecting another asset.
  • Applied Various Duration and calculation fixes throughout.
  • Various optimisation fixes.
Categories
Updates

New Multi Asset Visit Report

We are pleased to launch our new report
“MULTI ASSET VISIT REPORT”

Vision Trak is committed and focused on enhancing your user experience by periodically introducing new features and enhancements.

For our customers with multiple vehicles, you can now run this new Multi Asset Visit Report, that will allow you to ascertain where your vehicles go within a particular day.

The Multi Asset Visit Report plots a route for each vehicle that has been selected, on a single map allowing you to compare these routes as they have been drawn. You can use this report to optimise your route management for your customer’s deliveries.

With this report, you can review each route taken and look for any overlapping in customer visits and routes driven, to implement more efficient delivery routes and the subsequent saving of driver time and vehicle fuel costs.

Each route will show detailed information relating to visits and idling events, with their respective visit information contained in each of the flags. You may further cycle through each stop effectively replaying each route.

As always, we would welcome any feedback and feature suggestions, which may be forwarded directly to feedback@visiontrak.com.au


Categories
Updates

Dashboard Update

New Dashboard Coming Your Way

We have released a new feature that we call “DASHBOARD”. This will now become the default page that loads after logging in, offering a snapshot of your fleet and its health status.

Dashboard

The Dashboard displays a combination of live tiles and lists that will update when status changes occur and when certain events are triggered.

Live Tiles

Total Fleet – Is the total number of assets assigned to you

Depots – Displays the total number of Depots created by Visiontrak and currently the amount of assets that are currently in their respective depots (if assigned).

Awaiting Install – Total number of Kits awaiting their initial installation.

Uninstalled – Where the tracking system has been uninstalled and awaiting re-installation.

Maintenance – Vision Trak Flags this status on a vehicle that requires attention.

Not Responding – Display’s all assets that have not reported for a period of 3 days or more.

Duress

Vision Trak have now introduced a feature whereby we have electronically drawn zones (Depot) around most of our customer’s business address. Only Vision Trak Staff can create/modify these Zones. We can assign one Depot (Zone) to an Asset. We can therefore subsequently filter data in our reports and create events when an asset leaves thedepot and subsequently returns and relay this information in our New Dashboard.

Please note the following rules that apply to depots.

  • An Asset can only belong to one Depot.
  • Many assets can be assigned to one Depot.
  • A Depot can only belong to one Customer.
  • A Customer can have multiple Depots created to cater for multiple sites.
  • A Depot now has a time-zone applied based on location. This means that each asset based on its depot location, will have a time zone set for future reporting purposes. This will aid multi state based customers and fleet managers that will now see reports with correct time-zones applied for each asset individually based on its location, rather than the user login time-zone.

In the example below this customer has 9 assets in total, but only 5 assets have depots assigned to them.

Depots

Vision Trak have now introduced a feature whereby we have electronically drawn zones (Depot) around most of our customer’s business address. Only Vision Trak Staff can create/modify these Zones. We can assign one Depot (Zone) to an Asset. We can therefore subsequently filter data in our reports and create events when an asset leaves the depot and subsequently returns and relay this information in our New Dashboard.

Please note the following rules that apply to depots.

  • An Asset can only belong to one Depot.
  • Many assets can be assigned to one Depot.
  • A Depot can only belong to one Customer.
  • A Customer can have multiple Depots created to cater for multiple sites.
  • A Depot now has a time-zone applied based on location. This means that each asset based on its depot location, will have a time zone set for future reporting purposes. This will aid multi state based customers and fleet managers that will now see reports with correct time-zones applied for each asset individually based on its location, rather than the user login time-zone.

Live Lists

These Lists will populate if their respective Live Tiles show a number greater than 0.

Categories
Updates

Zone Filtering and Reporting Now Live

We have been busily working behind the scenes and are excited to release a few updates to bring you an improved experience, that I am sure will benefit you, in your tracking requirements.  We are introducing the first phase of implementing both Zones filtering and Zone event reporting by way of introducing the notion of a Depot.

Depots

In its first instance, Vision Trak have now introduced a feature whereby we have electronically drawn zones around most of our customer’s business address. Only Vision Trak Staff can create/modify these depots at this stage as there is a lot more work involved in securing this feature for customer use.

In the interim we can assign One Depot (Zone) to an Asset. We can therefore subsequently filter data in our reports and create events when an asset leaves the depot and subsequently returns. Please note the following rules that apply to depots.

  • An Asset can only belong to one Depot.
  • Many assets can be assigned to one Depot.
  • A Depot can only belong to one Customer.
  • A Customer can have multiple Depots created to cater for multiple sites.
  • A Depot now has a Timezone applied based on location. This means that each asset based on its depot location, will have a time zone set for future reporting purposes. This will aid multi state based customers and fleet managers that will now see reports with correct timezones applied for each asset individually based on its location, rather than the user login timezone.

Reports

If a depot has been assigned to an Asset, Depot related data will be included in our reports automatically. This can be easily viewed in the MVTL report.


MVTL REPORT

Without Depot Information

Without Depot Information

Depot information contain the first time it left the depot for the day and the last time it re-entered the depot for the day. We then provide you some extra metrics that calculates how long in total the asset was outside of the depot for the day, irrespective if returned and left depot previously. We also now analyze the time and distance traveled whilst outside of the depot and display these calculations accordingly.

Each crossing of a Depot is also listed as a Geo-Overlay event in the report

Running Summary Report

We have introduced two new sections to this report

1. Hourly Total Summary – utilises information relating to the Depot and breaks it down on an hourly basis

2. Hourly Summary Per Day – displays the information contained in the Hourly Total Summary for each day the report has been generated for.

Group Summary Report

If you tick the check box marked Use filtering prior to running this report it will generate an extra module containing and the Depot excluded data per asset averaged out on a per hour basis therefore enhancing the fleet utilisation data.

Categories
Updates

Speed Exception Reporting Update

Updated Reporting Logic

We have updated the current logic relating to existing speed exception reporting. We now only list the speeding exception once per speeding zone and its duration rather than listing it with every ping.

If the speed is returned to normal and then subsequently over speeds again in the same road segment, then a new exception will be logged. 

Speed exception are now grouped in their own section of the report, for exporting purposes.